
Investigatory project method
Class 12 investigatory project physics: how to plan, measure and conclude
Short answer
A class 12 investigatory project in physics answers one question by experiment: change one quantity, measure another, keep everything else the same, and let repeated readings and a graph decide the result. Gurukul Technicals Institute in Delhi supplies physics kits with a printed report, but the readings, the graph and the conclusion must be your own.
- Project marks (CBSE practical)
- 3 of 30, and the 5-mark viva covers it
- Worked plans on this page
- 14, each with what to change, measure and keep the same
- CBSE suggested projects among the plans
- 5 of the 8
- Kits shown
- Only those whose listing includes a printed report

What are the steps of a physics investigatory project?
An investigatory project tests how one physical quantity depends on another, using readings you take yourself. These ten steps take you from your book to a finished file.
An investigation measures how much one quantity depends on another; a demonstration only shows that something happens.
Pick a law from this year's chapters
Two quantities that a law in your NCERT book links, such as Ohm's law or Faraday's law.
Write one question
One quantity you change and one you measure: how does one depend on the other?
Name what you keep the same
Every other quantity that could matter, with its value.
Write your prediction (hypothesis)
The shape you expect and the reason from theory, before any reading.
Run a quick trial
If the meter hardly moves across the range, change the setup now.
Take six or more settings, three readings each
On your digital multimeter, metre scale or stopwatch, written down at once with units.
Plot the graph
On graph paper, with its shape described in words.
Name the real sources of error
Which way each one pushes your readings, and what you did about it.
Conclude within the range tested
Say whether the readings support your prediction, and claim nothing more.
Write up and prepare for the viva
Follow your school's format; the class 12 physics project guide covers the file and the viva questions.

CBSE's guidelines for practical examiners say that investigatory projects showing "considerable amount of effort and originality" should get suitably high marks, while a project "of a routine or stereotyped nature should only receive mediocre marks." In practice, a project looks routine when nothing in it is the student's own: no question, no readings, no graph.
How do you turn a physics chapter into a question you can test?
Start from your chapter, not from a list of titles. Look for two quantities that a law in your book links, and that you can measure with your school lab's apparatus.

Your question is ready when
- It names exactly one quantity you change and one you measure.
- You can say which law, and which chapter, predicts the answer.
- Your meter shows the change clearly, not only in the last flickering digit.
- You can take at least six settings across a sensible range, and repeat a bad set.
Weak questions are too wide ("What affects a transformer?") or cannot be measured in a school lab ("How fast do electrons drift?"). Narrow a wide one to a single factor, such as how a wire's resistance changes with its length.
Still choosing a topic? Physics project for class 12 maps each NCERT chapter to projects, and there are free class 11 and 12 physics project ideas in the project ideas finder.
Which quantities do you change, measure and keep the same?
Every investigation has three kinds of variable. Naming them before you start is what makes the test fair, and you should be ready to name them in the viva.

Choose a range, from your smallest setting to your largest, and put the settings closer together where the graph bends. Then write a prediction before any reading: the shape you expect and the reason from theory, not a number you hope to see. This is your hypothesis.
For the LDR plan: "As the lamp moves away, less light reaches the LDR, so its resistance rises and the current should fall, quickly at first and then more slowly."
Variables you did not mean to change
A wire or bulb that warms up changes its resistance. A battery's voltage drops with use, so note it at the start and end of every set. Daylight changes light readings by the hour, so close the curtains.
How do you take readings an examiner will trust?
Good readings are repeated, written down at once with their units, and never more precise than the instrument allows.
The least count of an instrument is the smallest change it can show: 1 mm on a metre scale, and on a digital multimeter one step in the last digit of the range in use, so write the range beside the reading. Never add decimal places the instrument cannot give, or drop a final zero you read: 2.50 V says more than 2.5 V.
Take each reading three times, resetting in between, and use the mean. Retake a reading far from the other two rather than dropping it. If a set going up the range disagrees with one coming down, something is warming up or drifting.
Rule the table before you start, with each unit in its heading. For the LDR plan it looks like this; add a column for the voltage across the LDR if you will work out its conductance.
| S. No. | Distance d (cm) | I₁ (mA) | I₂ (mA) | I₃ (mA) | Mean I (mA) | 1/d² (cm⁻²) | Remarks |
|---|---|---|---|---|---|---|---|
| 1 | |||||||
| 2 | |||||||
| 3 |

Before you write a reading down
- The meter shows zero with nothing connected, or its zero error is noted.
- The range is the lowest one that does not overflow.
- The reading has settled: a warming filament or a charging capacitor takes a moment.
- Your eye is level with an analogue needle, to avoid parallax.
Meters, cells and batteries
Never connect a multimeter set to a current range straight across a cell: it is almost a short circuit and can blow the meter's fuse. Switch off between readings, and unclip a 9 V battery when you pack up.
What does the shape of your graph tell you?
The graph is where readings become a result. Its shape, more than any single number, is what your conclusion should describe.
Put the changed quantity on the x axis and the measured one on the y axis, with units, on a scale of 1, 2 or 5 units per centimetre that fills most of the sheet. Draw one line or smooth curve as close to all the points as possible, with about as many above it as below; never join the dots. Read a slope from two points on the line far apart, not from two readings.
| Shape | What it tells you | Where it turns up below |
|---|---|---|
| Straight line through the origin | Direct proportion | Pencil line resistance against length |
| Straight line cutting an axis | A linear relation with an offset; intercept and slope both matter | A cell's terminal voltage against current: the intercept is the emf, the slope minus the internal resistance |
| Curve bending towards the x axis | The measured quantity grows more and more slowly | Current against voltage for a bulb filament |
| Falling curve that levels off | A fast drop, then a slower one | Capacitor voltage against time while discharging |
| A peak or a dip | One setting where the effect is largest or smallest | Series LCR current against capacitance (or frequency, on an adjustable source); prism deviation against incidence |
| A line or curve crossing zero | A balance point | Voltage across the middle of a Wheatstone bridge |
Straighten a curve when you can
A straight line is easier to judge than a curve. Going beyond the book, a discharging capacitor follows V = V0 e^(-t/RC), so ln V against time is a straight line of slope minus 1/RC; log V from your log table gives one too, of slope minus 1/(2.303 RC).
For the LDR, plot its conductance (the current divided by the voltage across the LDR) against 1/d², since the current alone also depends on the rest of the loop. Use a bare lamp, not a torch, whose reflector shapes a beam that does not fall off as 1/d²; even a bare bulb is a point source only from a distance. A bend may come from the LDR itself, stray light or a lamp too close: say which you think it is.
Write a conclusion the readings support
Say what the graph shows, whether it matches your prediction and the theory, and its limits: the range tested and the main source of error. For example: "The current fell as the lamp moved away, steeply at first, as I predicted. Against 1/d², the conductance was nearly straight, bending only at the shortest distances, where the bulb may be too close to act as a point source. The main error was stray light, so I closed the door and repeated each reading."
Which sources of error should your report discuss?
Naming the real errors in your own apparatus, and what you did about each, is worth more than a list copied from a book.
A systematic error pushes every reading the same way, like a meter that reads high; repeating cannot remove it, so find and correct it. A random error scatters readings both ways; repeating and averaging reduces it.
| Source | Kind | What to do about it |
|---|---|---|
| Zero error on a meter | Systematic | Read it with nothing connected and subtract that value |
| Loose or dirty contacts | Systematic: resistances read high | Clean and tighten clips; use short, thick leads |
| Wires, bulbs or cells warming up | Systematic, growing with time | Switch off between readings; keep each set short |
| Parallax on an analogue scale | Random | Eye level with the needle, directly in front |
| Stray light | Random | Darken the room; fix the lamp and LDR in line |
| Stopwatch reaction time | Random | Time longer intervals, or film the meter |
| A needle too slow for a quick pulse | Systematic: the swing follows the charge, not the peak | Use a fast peak-hold multimeter, or record the pulse on a laptop or oscilloscope |
Size an error, not just name it: 10.0 cm on a scale with a least count of 0.1 cm is uncertain by about 1 per cent, but 2.0 cm by about 5 per cent. So choose settings where readings are large.
Which investigations work for current electricity and capacitors?
Seven worked plans, each with apparatus that fits. "CBSE suggestion" marks a plan that follows one of the projects listed in the current syllabus.
| Question | Change | Measure | Keep the same | What to expect | Kit or apparatus |
|---|---|---|---|---|---|
| Does a bulb filament obey Ohm's law? | Voltage across the bulb | Current and voltage (two meters, or one moved between them) | The bulb; the wait before each reading | Current rises less and less, as the hot filament's resistance grows; a fixed resistor gives a straight line | A 6 V torch bulb on cells, a rheostat and a multimeter; the class 8 to 10 bulb and variable resistor board if it runs on cells |
| How does a pencil line's resistance depend on its length? | Length between the probes; then the grade | Resistance | Grade, line width, probe pressure | Proportional to length (R = ρl/A); a softer grade gives less | Pencil as a resistor |
| On what does a cell's internal resistance depend? (CBSE suggestion) | Current drawn, by changing the load; then a used cell | Terminal voltage and current | The cell; a short time per reading | V falls in a straight line as I rises (V = E minus Ir): intercept E, slope minus r | Lab: cell, rheostat, ammeter, voltmeter |
| Do Kirchhoff's rules hold in a real circuit? | The battery: fresh, then part-used | Each resistor's voltage; the main current | The board's fixed resistors, the meter | Currents into a junction equal currents out; the drops add up to the battery voltage, within meter error | Kirchhoff's law board |
| How does the voltage across a Wheatstone bridge's middle change as one arm changes? | One arm's resistance | Voltage between the middle points | The other arms, the cell | It passes through zero and changes sign at balance, where P/Q = R/S | Wheatstone bridge with multimeter: its resistors are fixed, so build the changing arm yourself, as its build guide shows, and use its multimeter |
| How does an LDR's current change with lamp distance? (CBSE suggestion) | Lamp distance; or lamp power | Current through the LDR, and the voltage across it | Lamp power (or distance), supply, dark room | Falls as the lamp moves away, steeply at first, as the LDR's resistance rises | LDR light intensity meter, with a bare bulb |
| How does a capacitor's discharge time depend on resistance? | Discharge resistor; then capacitance | Voltage at regular times, or time to fall to half | Supply voltage, starting charge | Falls fast, then slowly; time to half is proportional to RC, so doubling R doubles it (beyond the NCERT text: an extension your teacher agrees to) | Capacitor discharge kit: discharge its 4700 µF capacitor through resistors of your own (10 kΩ or more makes the fall slow enough to time), not its LED, with a multimeter across it |
Four of these have a free idea page with a method: internal resistance from a V-I graph, why a hot filament is not ohmic, Kirchhoff's laws on a two-loop board and the RC time constant with a stopwatch.
Capacitors, soldering and hot bulbs
In a DC circuit, an electrolytic capacitor fitted the wrong way round, or above its voltage rating, can swell or burst: check the stripe and the rating first, and discharge a large one through a resistor.
Keep the soldering iron on a stand, with an adult nearby, and unplug it when you finish.
The light intensity meter board (not the sliding-torch board) lights its bulb from the mains: an adult plugs it in, and your probes stay on its 9 V side. Let hot bulbs cool before moving them.
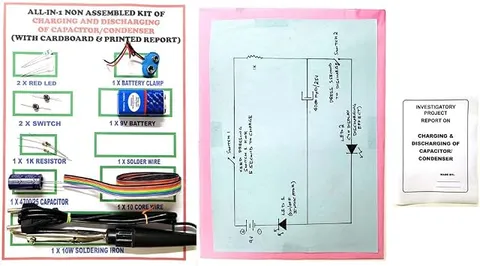
Every kit below comes with a printed report, according to its listing. It helps with the written part, but it cannot hold your readings. Most boards have no meter of their own, so keep a digital multimeter ready.
Kits for the resistance and circuit-law plans
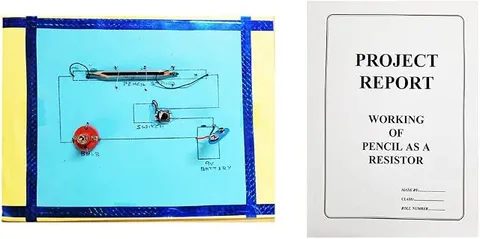
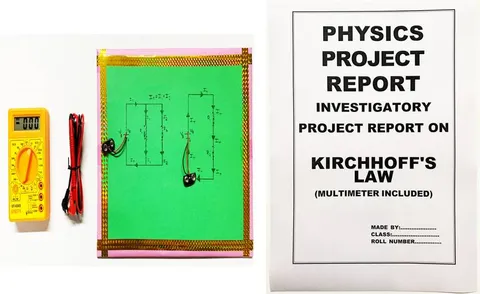
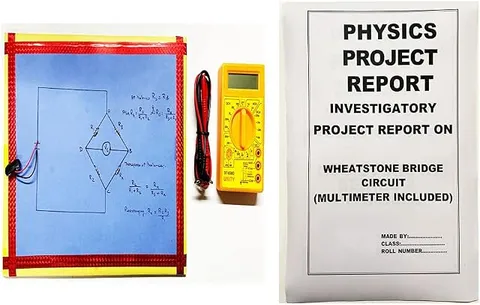
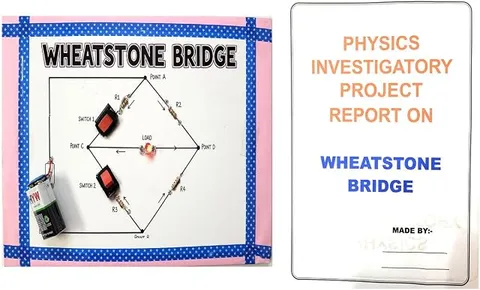
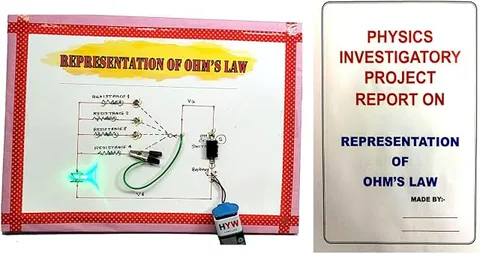
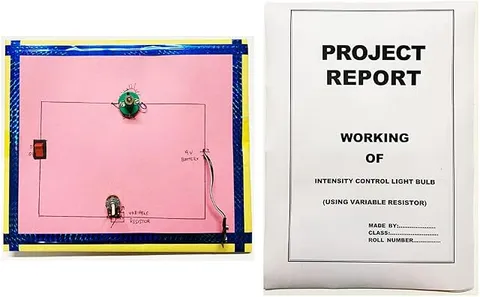
For the LDR plan: the light intensity meter has its own multimeter and a mains bulb holder; the sliding-torch board (class 8 to 10, on a 9 V battery) suits a first trial.
Kits for the LDR plan
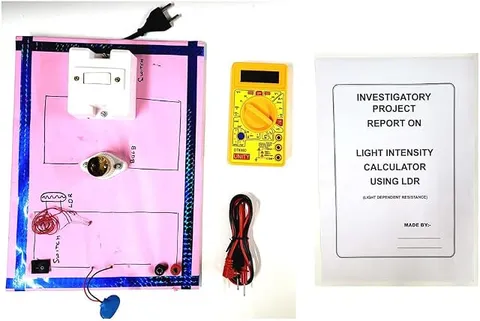
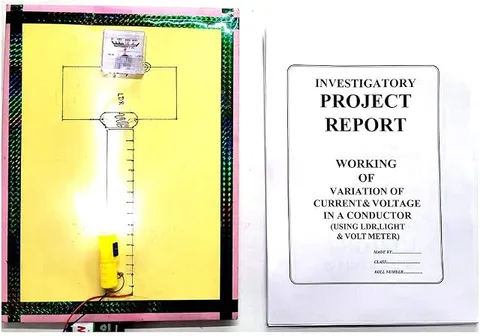
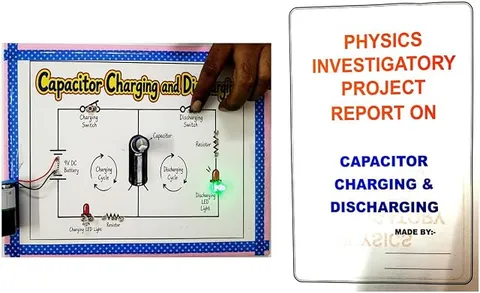
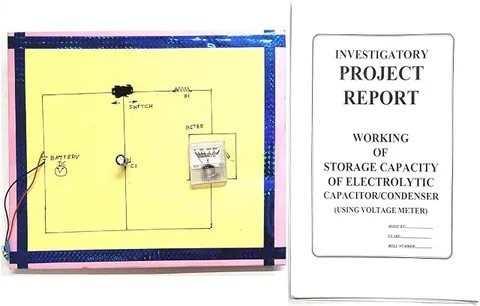
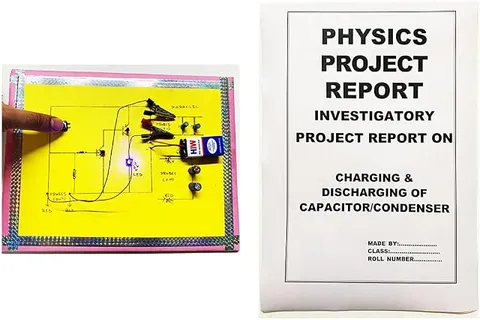
For the capacitor plan: both charge and discharge boards empty through an LED, too fast to time and stopping short of zero, so treat that as a demonstration. The series and parallel board changes C.
Kits for the capacitor plan
Which investigations work for induction, AC, diodes and optics?
Seven more plans, from Faraday's law to the hollow prism. Several use a step-down transformer on a mains lead, so read the safety box below the table before using them.
| Question | Change | Measure | Keep the same | What to expect | Kit or apparatus |
|---|---|---|---|---|---|
| How does induced emf depend on the speed of a magnet through a coil? | Drop height of a magnet through a plastic pipe, your coil near its lower end | Peak emf, on a multimeter with fast peak-hold (mV range) or recorded through a laptop's microphone socket | Magnet, coil, which pole enters | The peak grows with speed, so roughly with the square root of the height; a needle is too slow for a falling magnet's pulse: its swing then follows the charge, the same from every height, so it cannot show this | Your own coil and pipe; the Electromagnetic induction board shows the effect by hand, but its needle cannot follow a quick pulse |
| How does mutual induction change with the gap between two coils? | The gap; then a steel strip joining the cores | AC voltage across the second coil | Supply, turns, coils parallel | Falls fast as the gap grows; rises when the cores are joined, as more flux links the second coil | Coils you wind on two bolts, following the Mutual induction board build guide, an adult wiring its mains side; unplug before each move |
| On what does a coil's self-inductance depend? (CBSE suggestion) | How far a steel rod goes in; frequency only on an adjustable AC source in the school lab, as CBSE's suggestion asks | Current, or bulb voltage | Supply, bulb, coil | The bulb dims as the rod goes in, as inductance and reactance rise; a higher frequency dims it too (X_L = 2πfL); on steady DC the rod changes nothing | Self induction board |
| How does a transformer's output depend on its turns ratio? (CBSE suggestion) | Secondary turns, using tappings on a coil you wind | Output AC voltage | Primary turns, input voltage, core | Voltage ratio close to the turns ratio, a little short because of flux leakage and losses | Your own coils on a soft iron core, on a low-voltage AC supply your teacher sets up |
| How does the current in a series LCR circuit change as it is tuned? | Capacitor, or an iron core in the coil (frequency only on an adjustable source) | Current, or lamp voltage | Supply voltage, lamp | Largest where the two reactances are equal, at f = 1/(2π√(LC)); at the board's fixed 50 Hz, a peak shows only if your change crosses that point | Series LCR board, unplugged, with non-polarised capacitors of your own (never an electrolytic) or an iron rod in its coil |
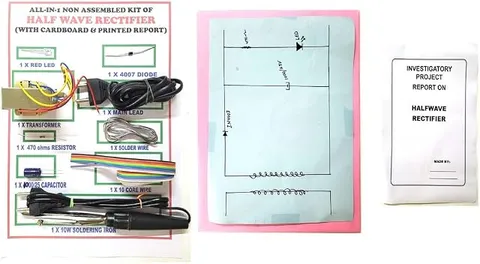
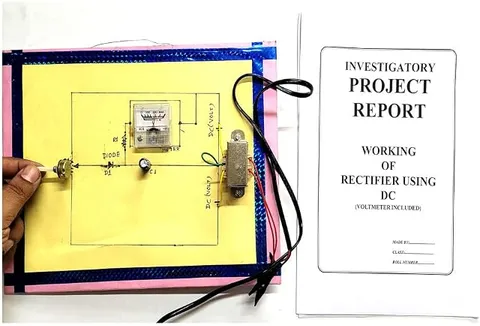
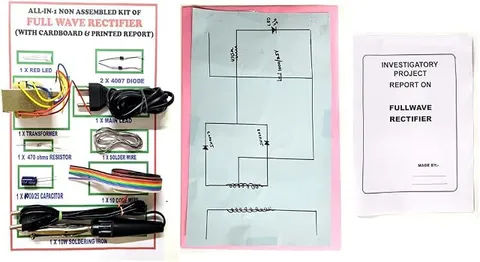
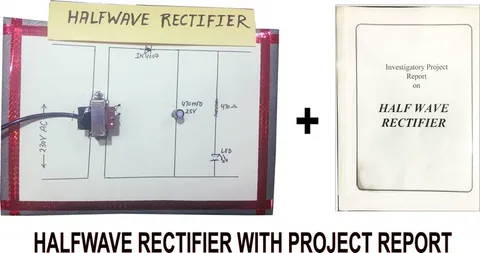
| How does the filter capacitor change a rectifier's output? | Capacitor (none, then two values); then the load | DC output voltage | Transformer, diodes, load | Rises towards the AC peak; a larger capacitor or lighter load holds it nearer; full wave holds up better than half wave | Half wave kit or full wave kit |
| How does deviation depend on incidence for liquids in a hollow prism? (CBSE suggestion) | Angle of incidence; then the liquid | Angle of deviation | Prism, pins, board | Falls to a minimum, then rises; the higher refractive index gives the larger minimum | Lab: hollow prism, water, clear oil, pins, protractor |
Mains-powered boards and magnets
Several boards have a step-down transformer with its own mains lead. An adult plugs them in and switches them off; nobody touches the mains side while it is plugged in. Take readings on the low-voltage side only, and unplug before changing any part.
An adult joins and covers a DIY kit's mains wiring; you solder only the low-voltage side, plug out. On AC, an electrolytic capacitor can burst whichever way round it is fitted.
If a board smells hot, buzzes loudly or has a damaged lead, unplug it and tell your teacher. Strong magnets pinch fingers when they snap together.
Practise the pin method with the glass prism deviation curve before filling the hollow prism, and see induced emf against magnet speed for the pipe, the coil and two ways to catch the pulse.
For the induction and AC plans: the induction board shows by hand that a faster magnet gives a bigger swing, but cannot follow a falling one; the coil and LCR boards run at the fixed mains frequency.
Kits for the induction and AC plans
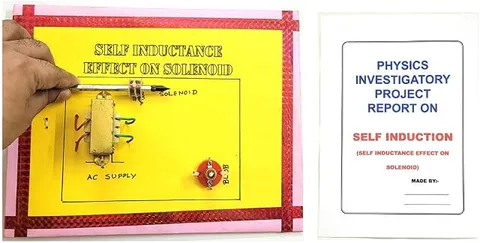
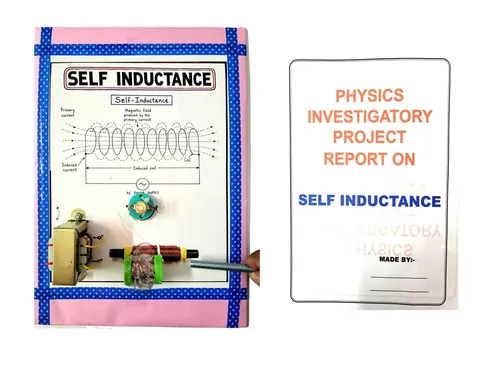
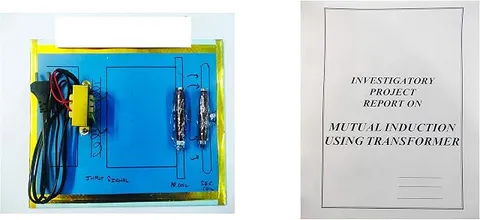
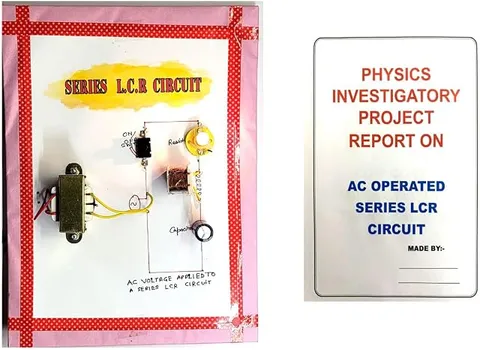
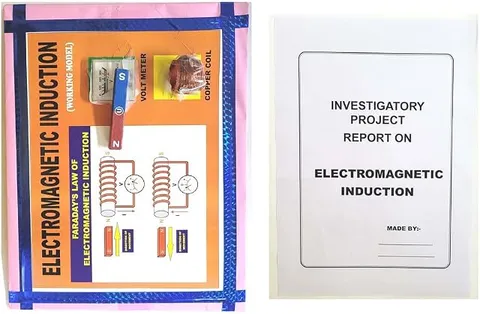
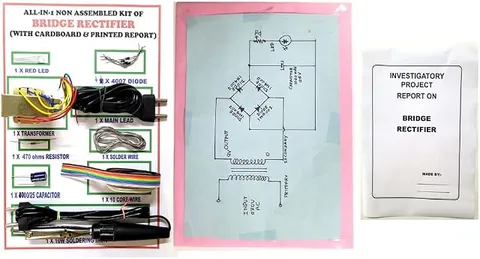
For the rectifier plan: the three DIY kits let you build with and without the filter capacitor; an adult wires their mains side.
Kits for the rectifier plan
How do you turn a ready-made model into an investigation?
A ready-made working model or a DIY kit gives you apparatus that works. These steps add your own question and your own readings.
Find one thing to vary
A knob, a switch, a loose core or a part you can swap; if nothing varies, add something, such as a lamp you can move.
Add a way to measure
Most boards show an effect, not a number: add a digital multimeter, a stopwatch or a metre scale.
Write the question and the prediction
In your own words, with the reason from theory and what you will keep the same.
Trial, then the full set
Sweep the range once, then take six or more settings, each read three times.
Write it up yourself
Use the printed report to help with the written part; the observations, graph, errors and conclusion come from your own work.
| Model or kit | What it shows as supplied | Your investigation |
|---|---|---|
| Self inductance board | A bulb dims when a rod is pushed into the coil | Mark the rod at equal steps and measure the current at each depth |
| Wheatstone bridge board | An LED lights when the bridge is far out of balance one way | Measure the voltage between the middle points for each switch setting |
| Bridge rectifier kit | Parts for a bridge rectifier that lights an LED | Measure the DC output without the capacitor, then with it |
The printed report is a starting point
A report printed for every buyer cannot hold your readings: let it help with the written part, and take every reading yourself.
How do you plan your investigation on one sheet?
Plan on one sheet before your first reading, then run the same checks at the start of every session, so your readings stay consistent from day to day.
Print the planning sheet and fill it in before your first reading; it includes a grid for three readings at every setting.
Start of every session
- The same cell, coil, lamp and meter as last time.
- Battery voltage checked and written down.
- Mains boards plugged in by an adult; your hands on the low-voltage side only.
- The room darkened for light plans; spare magnets and steel tools kept away from the coil for induction plans.
- Last session's readings read through, so the method stays the same.
The free ebooks Investigatory Projects for Class 11 and 12 and Viva Questions for Science Projects go further. For a school exhibition, see project for science exhibition, best project for science exhibition and best model for science exhibition.
Questions about doing a physics investigation
Short answers to what students, parents and teachers ask about projects most often. Tap a question to open its answer.
Is the investigatory project compulsory in the class 12 physics practical?
Plan for one. The CBSE scheme gives it 3 of the 30 practical marks, the record you submit must include its report, and the 5-mark viva covers it. The project guide sets out the full split.
What are the independent, dependent and controlled variables in a physics project?
The independent variable is the one you set, such as the lamp's distance from an LDR; the dependent variable is what you read, such as the current; the controlled variables are everything you hold steady, such as lamp power.
How many settings and repeats does a physics graph need?
Enough points to show the graph's shape: aim for six or more settings across the range, closer together where it bends, each read three times and averaged.
Can I copy readings from a printed project report?
No. A report printed for every buyer cannot hold your readings, and the viva can ask how you took each one. Let it help with the written part only.
My transformer's voltage ratio comes out below its turns ratio: is my project wrong?
No. Flux leakage and losses in the core and coils make a real transformer's voltage ratio fall a little short of its turns ratio. Check your meter, then say so in your conclusion: it is a finding, not a failure.
How do I find the slope of my graph, and what does it tell me?
Divide the change in y by the change in x between two points on your line far apart, keeping the units. What it means comes from the law: for a cell's terminal voltage against current, the slope is minus the internal resistance.
Do I need an oscilloscope for a rectifier investigation?
No. A multimeter on its DC range shows the output with and without a filter capacitor. An oscilloscope adds the waveform: half wave ripple repeats at the supply frequency, 50 Hz on Indian mains, full wave at 100 Hz.
Why does my graph not pass through the origin when the theory says it should?
A zero error on a meter, or the resistance of clips and leads, adds the same amount to every reading, so the line cuts an axis. Check the meter with nothing connected, clean the contacts, and say in your file what the intercept means.
What is a hypothesis in a physics investigatory project?
It is your prediction with its reason, written before any reading, for example "the LDR current will fall as the lamp moves away, because less light reaches it". Your readings decide, and a wrong hypothesis honestly reported can still make a good project.
Delhi head office
Ask about a kit for your investigation
Send the Delhi head office your topic, your class and the date your practical file is due. Ask which kit or model suits the question you want to test and whether its listing includes a printed report. Each project can be bought on Amazon or Flipkart from its page, or ordered on WhatsApp.