- Biology
- Ready-made model
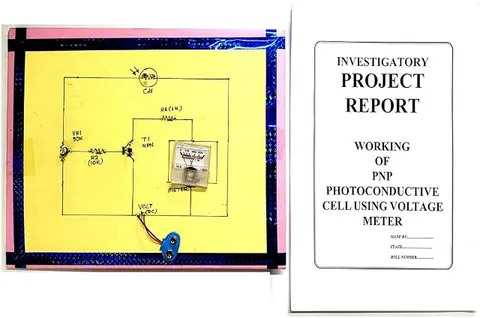
Photoconductive Cell Using Voltmeter Physics Working Model Educational Science Project
Code B0C3H7M6WW
- Paid for and delivered by Amazon. The current price and the delivery date for your PIN code are shown there.
- Sold by Gurukul Technicals Institute, Delhi.
- Need a different topic, a custom version or a school order? Ask on WhatsApp.
In this project guide
Ready-made model
About this model
This working model studies a photoconductive cell (a light dependent resistor) and uses a voltmeter to show how its electrical behaviour changes with light. It turns the effect of light on a semiconductor into readings that a student can record, tabulate and plot.
How it works
The science behind it
The idea the model demonstrates, in words you can use in your report and when you explain it.
A photoconductive cell is a semiconductor device whose conductivity increases when light falls on it. In a semiconductor most electrons are held in the valence band. A photon with energy greater than the band gap can lift an electron into the conduction band, leaving a hole behind, and both can then carry current. Brighter light means more photons, more electron-hole pairs and so lower resistance. Photon energy is E = hν = hc/λ, so light of too long a wavelength cannot free electrons at all, which is why each material responds best to a particular range of colours. For voltmeter readings, the cell is usually connected in series with a fixed resistor across a steady supply; as light increases, more current flows and the voltage across the fixed resistor rises. Moving a lamp closer step by step and noting each reading gives a table that can be plotted as a graph. The light meters in older cameras used such cells.
Make it yourself
Make a photoconductive cell experiment with a voltmeter yourself
Build your own version from scratch, or use the steps to understand how the ready-made model is put together before you present it.
What you need 9
Step by step 8 steps
Connect the LDR and the 10 kΩ resistor in series across the battery: battery positive to the LDR, LDR to the resistor, resistor to battery negative.
Set the multimeter to DC volts (20 V range) and connect it across the 10 kΩ resistor. As more light falls on the LDR, its resistance falls and this voltage rises.
Fix the torch at one end of the black box and mount the LDR on a small card that slides along the scale, facing the torch.
In a dark room, switch on the torch and record the voltmeter reading with the LDR at 10, 15, 20, 25, 30 and 40 cm from the torch.
Take each reading three times and average them, and also record the reading with the torch off, which is the dark value.
Work out the LDR's resistance from each reading using R(LDR) = 10 kΩ × (V(battery) − V) / V, and check one or two values directly on the ohms range with the battery disconnected.
Hold each colour filter over the torch at one fixed distance and record the reading, keeping everything else the same.
Plot voltage against distance, and resistance against 1 / distance², and display the graphs beside the board.
Read this first
Safety first
Go through these points before you build or switch anything on. Younger students should do this with an adult.
- Use a small LED torch rather than a hot lamp, so nothing inside the box can overheat.
- Measure resistance only with the battery disconnected, and choose the meter's range before connecting it.
- Most LDRs contain cadmium sulphide, which is toxic: do not break or scratch one, wash your hands after handling it, and put old ones in e-waste.
- Keep the battery terminals covered when the experiment is packed away.
Troubleshooting
If something does not work
The usual problems with this model and how to fix them. Open a problem to see the fix.
The voltage hardly changes when the torch moves
Room light is reaching the LDR, or the meter is across the wrong part. Work in a dark room with the box closed except for its open end, and check the meter is across the 10 kΩ resistor.
The reading keeps drifting for a while
LDRs respond slowly, especially when the light is reduced. Wait about half a minute at each position before writing the reading down.
The voltage falls as the torch gets closer
The meter is connected across the LDR instead of the resistor. That is not wrong, but the voltage then falls with more light; either swap it over or explain the reverse trend in your report.
The colour filters give odd results
The filters may differ in thickness, and an LED torch gives out more of some colours than others. Note both as sources of error and use a single layer of each filter.
Exhibition day
How to present it
A running order for the exhibition table or the practical, step by step.
Record voltmeter readings with a lamp at several distances and show them in a neat table.
Plot a graph of voltmeter reading against distance and explain its shape.
Explain the band gap idea with a simple energy-level diagram.
Keep the room lighting the same during readings so that only your lamp changes.
Practice
Viva questions
Practice questions on this model, with short answers. Try each one aloud before you open the answer.
What is a photoconductive cell?
A semiconductor device, such as a cadmium sulphide LDR, whose resistance decreases when light falls on it.
Why does its resistance fall when the light increases?
Light frees more electron-hole pairs in the semiconductor, so there are more charge carriers to carry current.
What is the energy of a photon of frequency ν?
E = hν, where h is Planck's constant, about 6.63 × 10⁻³⁴ J s.
Why does the voltmeter reading change in this experiment?
As the cell's resistance changes, the current in the circuit changes, so the voltage across the measured part changes too.
Project file
Project file outline
The headings of the project file, in order. Give each heading its own section and write it in your own words.
Free ebook: Writing a Science Project FileContents
- Aim: to study how the resistance of a photoconductive cell changes with the intensity of light
- Introduction: semiconductors and the photoconductive effect
- Theory: photon energy E = hc/λ and the formation of electron-hole pairs
- Circuit diagram: the LDR in a voltage divider with the voltmeter
- Observation table: distance, voltmeter reading and calculated resistance
- Graphs of voltage against distance and resistance against 1 / distance²
- Effect of colour filters on the reading
- Applications: street lights, camera exposure meters and burglar alarms
- Sources of error, precautions and conclusion
Buying checklist
Before you buy
What to check before you order the model, and what to do when it arrives.
1Before you order
- Check with your teacher how much theory is expected at your class level, as photoconductivity can be explained simply or in depth.
- Read the listing to see what kind of meter the model uses and what powers it, and keep a multimeter of your own handy for extra readings.
- Keep your readings table and graph ready to show, as examiners often ask for observed data.
- Pack it in its box so the meter and sensor are not knocked.
- Check the delivery date for your PIN code on the marketplace, and order well before the exhibition or practical.
2When it arrives
- Take a full set of readings at home in a dark room soon after it arrives, because a bright exhibition hall makes readings hard to repeat.
Next steps
Take it further
Ways to turn this model into a bigger investigation or a stronger exhibition entry.
Time how long the reading takes to settle after the torch is switched off and on, and discuss the LDR's slow response.
Compare the LDR with a photodiode on the same distance scale and discuss which suits a fast light sensor.
Use a phone light meter app to record lux, and plot resistance against lux on a log scale.
Audience
Who it suits
Class 11 and 12 physics students who need an investigatory project with measurements, a table of readings and a graph.
- SubjectBiology
- TypeReady-made model
Free to read
Free ebooks for this topic
Free PDF ebooks from Gurukul Technicals Institute on the science, the making and the presenting of projects like this one.
- Free PDF ebook
Biology Models Guide
Make the heart, lungs, kidney, eye, cell and more, and explain them well
- Free PDF ebook
Physics Working Models Explained
Twenty classic models, how each works and how to make it
- Free PDF ebook
Your Science Exhibition Guide
Choose a project, build it, present it and answer the judges with confidence
- Free PDF ebook
Writing a Science Project File
How to write the report, from the cover page to the bibliography